IT
IT  EN
EN  ES
ES  FR
FR  DE
DE 
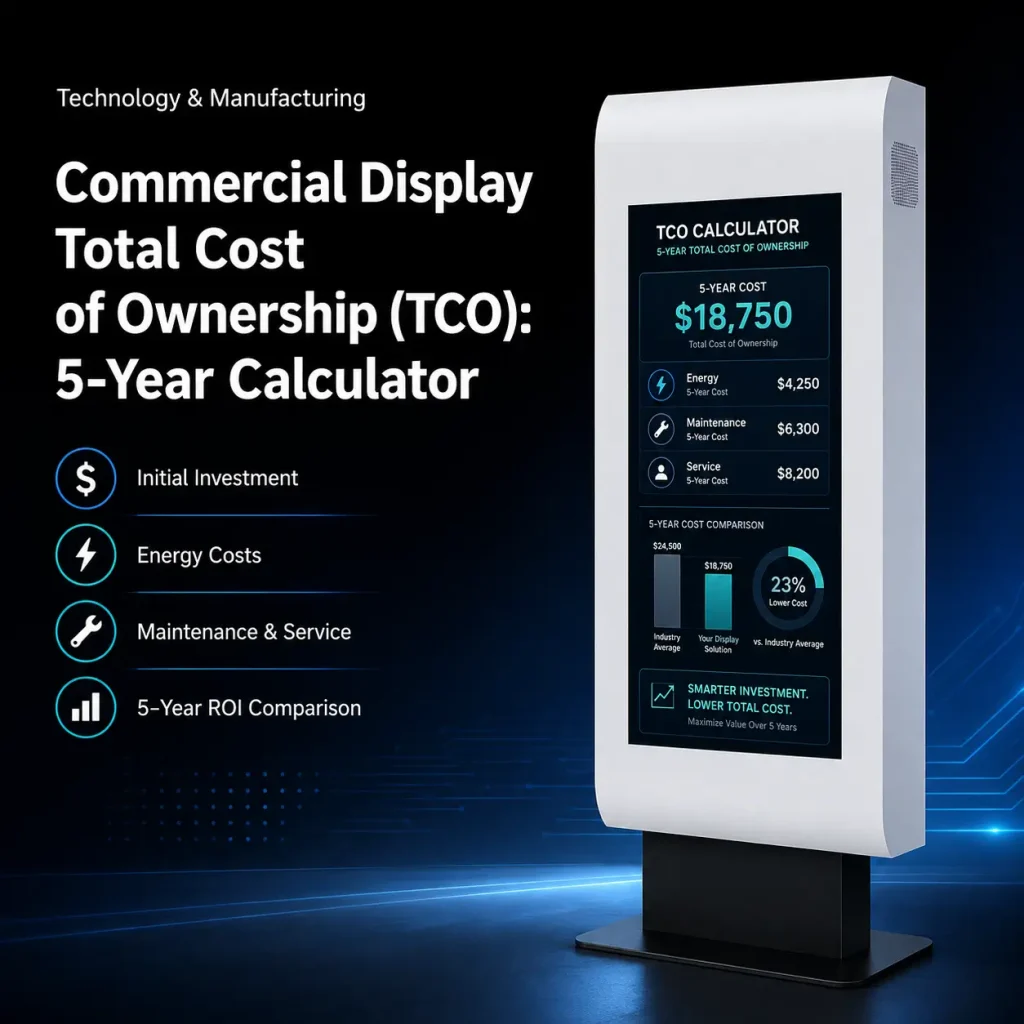
Commercial Display Total Cost of Ownership (TCO): 5-Year Calculator
Quick Answer: the purchase price of a commercial display is only 35–45% of its true 5-year cost. For example, budgeting by unit price alone guarantees budget overruns.
Where the other 55–65% goes: – Software/CMS licenses: 10–20% – Installation and mounting: 5–10% – Power consumption: 10–15% – Maintenance and repairs: 8–12% – Content creation: 5–15% – Downtime cost: 5–10% – End-of-life disposal: 1–3%
Real example –50-unit outdoor network: – Hardware: $125,000 (27.5% of total) – 5-Year TCO: $477,750 – That’s 3.8× the hardware cost.
Surprising finding: a premium $3,800 display can have a lower 5-year TCO ($8,835) than a budget $1,800 display ($9,412). Why? Lower power consumption (220W vs. 380W), higher reliability (50,000hr MTBF vs. 20,000hr), included RDM software, and longer warranty.
The single best TCO reducer: Remote Device Management (RDM) cuts service calls by 40–60% and downtime by 50%+ yielding a 12–20% total TCO reduction over 5 years.
Definition: TCO (Total Cost of Ownership) is a financial estimate that captures all direct and indirect costs associated with purchasing deploying, operating, maintaining, and disposing of a commercial display over its full lifecycle –typically 5–7 years. Take this includes hardware, software, installation, power, maintenance, content creation, downtime, and disposal.
Definition: MTBF (Mean Time Between Failures) is a reliability metric indicating the average operating time between failures for a display system. A higher MTBF (e.g., 50,000 hours vs. 20,000 hours) translates directly to fewer service calls, lower spare parts costs, and less revenue lost to downtime.
Introduction: Why Unit Price Is Only 40% of True Cost
When procurement teams evaluate commercial display options, the instinct is to focus on the unit price. In practice, it’s the most visible number, the easiest to compare, and the one that shows up immediately on the purchase order. But here’s the reality: the hardware unit price represents only about 35–45% of the total cost of ownership over a 5-year deployment lifecycle.
The remaining 55–65%? Typically, it’s buried in software licenses, installation labor, electricity bills, maintenance contracts, content creation, downtime, and eventual disposal. A display that costs $1,000 less at purchase can cost $3,000 more over five years if it consumes more power, fails more often, or requires a paid CMS subscription that a premium alternative includes for free.
This guide provides a comprehensive 5-year TCO model for commercial display deployments, complete with a scenario calculator. A real-world cost breakdown and actionable strategies to reduce total cost without sacrificing performance.
Table of Contents
- The 8 Components of Display TCO
- 5-Year TCO Calculator: Budget vs. Mid-Range vs. Premium
- Real Example: 50-Unit Outdoor Network Deployment
- How to Reduce Your TCO
- ROI Model: Advertising Revenue vs. TCO (see our digital signage vs. print ROI comparison for the full break-even analysis)
- Hidden Cost Traps: When Cheap Displays Cost More
- FAQ
- Conclusione
The 8 Components of Display TCO
A complete display cost analysis accounts for every dollar spent from procurement to decommissioning. Here are the eight cost components you must include:
1. Hardware Cost
The upfront purchase price of the display itself –the number most buyers fixate on. These include the panel, enclosure, media player (if integrated), and standard accessories. For outdoor displays, this also includes climate control systems (fans, air conditioning, heaters).
Typical share of 5-year TCO: 35–45%
2. Software and CMS
Content management systems range from free basic players a enterprise-grade RDM platforms costing $5–30 per screen per month. Over five years, a $20/month CMS subscription adds $1,200 per screen –often exceeding the hardware cost of budget displays.
Typical share of 5-year TCO: 10–20%
3. Installation
Mounting hardware, cabling, power connection, network configuration, and labor. outdoor installations cost significantly more due to structural supports, weatherproofing, and permitting. A single outdoor kiosk installation can run $500–2,000.
Typical share of 5-year TCO: 5–10%
4. Power Consumption
Commercial displays run 12–14 hours per day, 365 days a year. A 55-inch outdoor display drawing 300W at $0.15/kWh for 18 hours/day costs $296/year in electricity. Over 5 years, that’s $1,480 per screen –and high-brightness outdoor displays can consume double that.
Typical share of 5-year TCO: 10–15%
5. Maintenance and Repairs
Including spare parts (LCD panels, power supplies, fans, backlight modules), field service labor, and extended warranty contracts. Take outdoor displays require more maintenance due to environmental exposure. Budget 3–5% of hardware cost annually.
Typical share of 5-year TCO: 8–12%
6. Content Creation
Designing, scheduling, and updating digital signage content. Whether you use in-house designers, freelancers, or agency partners, content is an ongoing cost. Annual content budgets range from $100/screen (simple automated playlists) to $1,000+/screen (custom creative with frequent updates).
Typical share of 5-year TCO: 5–15%
7. Downtime Cost
When a display goes dark, it stops generating revenue or communicating information. In practice, for advertising networks, downtime equals lost ad revenue. For wayfinding displays, it means customer frustration. Estimate downtime cost based on revenue per screen per day × average days of outage per year.
Typical share of 5-year TCO: 5–10%
8. Disposal and End-of-Life
Decommissioning, e-waste recycling, and removal labor. Typically, commercial displays contain materials requiring proper disposal (lead solder, mercury in some backlights, lithium batteries in some media players). Budget $50–150 per screen for responsible end-of-life handling.
Typical share of 5-year TCO: 1–2%
5-Year TCO Calculator: Budget vs. Mid-Range vs. Premium
The following model compares three scenarios for a 55-inch outdoor LCD display deployed for 5 years at 18 hours/day operation. All figures are in USD and based on industry averages .
Scenario Assumptions
| Parameter | Budget Display | Mid-Range Display | Premium Display |
| Hardware (unit price) | $1,800 | $2,500 | $3,800 |
| Luminosità | 2,500 nits | 3,000 nits | 3,500 nits |
| Power consumption | 220W | 280W | 380W |
| CMS | Free basic player | $10/month RDM | $0 (RDM included) |
| Warranty | 1 anno | 2 years | 3 years |
| MTBF (Mean Time Between Failures) | 20,000 hrs | 35,000 hrs | 50,000 hrs |
5-Year TCO Breakdown (Per Screen)
| Cost Component | Budget Display | Mid-Range Display | Premium Display |
|---|---|---|---|
| 1. Hardware | $1,800 | $2,500 | $3,800 |
| 2. Software/CMS (5 yrs) | $0 | $600 ($10/mo × 60) | $0 (included) |
| 3. Installation | $800 | $700 | $600 |
| 4. Power (5 yrs @ $0.15/kWh) | $1,872 | $1,380 | $1,085 |
| 5. Maintenance & Repairs | $1,440 (8%/yr) | $875 (3.5%/yr × 5 yrs after yr 2 warranty) | $570 (3%/yr × 3 yrs after yr 3 warranty) |
| 6. Content Creation | $500/yr ($2,500) | $500/yr ($2,500) | $500/yr ($2,500) |
| 7. Downtime Cost | $900 (5 days/yr × $36/day) | $360 (2 days/yr × $36/day) | $180 (1 day/yr × $36/day) |
| 8. Disposal | $100 | $100 | $100 |
| 5-Year TCO Total | $9,412 | $9,015 | $8,835 |
| TCO as % of hardware price | 523% | 361% | 232% |
How to Reduce Your TCO
Reducing TCO doesn’t mean buying the cheapest display –it means optimizing every cost component. Here are the most effective strategies:
1. Invest in Remote Device Management (RDM)
A robust RDM system –like MWE (Marvel Technology)’s OMC platform –allows you to monitor display health, push content updates, schedule reboots receive failure alerts remotely. This reduces:
- On-site service calls by 40–60%
- Downtime duration by enabling proactive issue detection before total failure
- Content distribution costs by eliminating manual USB updates
Even if the RDM costs $10/screen/month, the savings in service labor and reduced downtime typically deliver a 3–6 month payback.
2. Prioritize Energy Efficiency
Displays with auto-brightness adjustment(using ambient light sensors) can reduce power consumption by 25–50% in real-world conditions. A 55-inch outdoor display that dims to 1,500 nits at night (vs. running 3,000 nits constantly) saves approximately $120/year per screen in electricity.
3. Choose Longer Warranties
A 3-year warranty vs. a 1-year warranty eliminates repair costs for years 2–4, which are typically when component failures begin. The cost of extended warranty coverage (2–5% of unit price per year) is almost always lower than the expected repair cost.
4. Implement Preventive Maintenance
Scheduled cleaning (especially for outdoor displays), air filter replacement, and thermal system inspection can extend display lifespan by 20–50% and prevent catastrophic failures. Budget $50–100/screen/year for preventive maintenance.
5. Buy Spare Parts with the Initial Order
Ordering 3–5% spare units (or critical spare parts like power. Supplies and LCD panels) with the initial purchase locks in current pricing and ensures immediate availability when failures occur. this reduces downtime from weeks (waiting for international shipping) to hours.
6. Standardize Your Display Fleet
Deploying the same model across all locations simplifies spare parts management, streamlines content creation, and reduces training costs for maintenance staff. Mixed fleets increase complexity and TCO.
ROI Model: Advertising Revenue vs. TCO (see our digital signage vs. print ROI comparison for the full break-even analysis)
For advertising-funded display networks, TCO must be evaluated against revenue. Here’s a simplified break-even model.
Revenue Assumptions (Per Screen)
| Parameter | Value |
| Ad slots per day | 1,440 (15-second loops) |
| Sell-through rate | 30% (432 ad plays/day) |
| Average CPM (cost per mille) | $8 |
| Daily revenue per screen | $3.46 |
| Annual revenue per screen | $1,262 |
| 5-year revenue per screen | $6,310 |
Break-Even Analysis
Using the mid-range scenario from our TCO calculator ($9,015 per screen over 5 years):
- 5-year revenue: $6,310
- 5-year TCO: $9,015
- Net result: -$2,705 per screen (not profitable on advertising alone)
This illustrates a critical reality: advertising revenue alone rarely covers full TCO for outdoor display networks. Successful deployments typically combine:
- Advertising revenue (40–60% of total revenue)
- Internal promotions and tenant communications (20–50%)
- Operational savings from digitized wayfinding/menu boards (10–20%)
- Enhanced customer experience and footfall attribution (10–20%)
When all value streams are quantified, the total benefit typically reaches $10,000–15,000 per screen over 5 years, producing a positive ROI.
Hidden Cost Traps: When Cheap Displays Cost More
Trap 1: Proprietary CMS Lock-In
Some budget displays ship with a free CMS that only works with that manufacturer’s hardware. When you expand your network with displays from other brands, you need a second CMS –doubling your software management cost. Always ask:“Does the CMS support third-party displays via industry standards (SMIL, HTML5)?”
Trap 2: Non-Standard Spare Parts
Budget manufacturers sometimes use non-standard power supplies or driver boards that are difficult to source after the warranty expires. If the manufacturer discontinues the model, you may need to replace the entire display rather than a $50 component. Always request a spare parts availability commitment (ideally 5+ years).
Trap 3: Inflated Brightness Specs
Some manufacturers advertise “3,000 nits” but the display only sustains. That brightness for the first 30 minutes before thermal throttling reduces it to 1,800 nits. This leads to unreadable displays in direct sunlight –and the “fix” is buying a more expensive display. Always request sustained brightness specifications, not peak brightness.
Trap 4: No Remote Diagnostics
Displays without remote health monitoring force you to discover failures through customer complaints or manual site visits. This extends downtime from hours to days or weeks. The cost of one extended downtime event can exceed the price difference between a budget and premium display.
Trap 5: High Idle Power Consumption
Some displays consume significant power even when the screen is off (standby mode) –15–0W vs. <3w for energy-efficient models. take across 50 screens over 5 years, this adds $3,000–8,000 in wasted electricity.
FAQ
Q1: What is the average lifespan of a commercial outdoor display?
Quality outdoor LCD displays have an MTBF of 30,000–50,000 hours and a typical operational lifespan of 5–7 years under continuous use. LED backlight degradation usually determines end-of-life, with brightness dropping to 50% of original output after approximately 50,000 hours.
Q2: How much should I budget annually for maintenance per screen?
For indoor displays, budget 3–5% of hardware cost per year. For outdoor displays, budget 5–10% per year due to environmental exposure. This covers spare parts, field service, and preventive maintenance but excludes extended warranty contracts.
Q3: Does a 3-year warranty really save money vs. a 1-year warranty?
Yes. In practice, display failure rates spike in years 2– as components age. A 3-year warranty eliminates repair costs during this period, typically saving $200–600 per screen in parts and labor. The cost of the extended warranty is usually 40–60% lower than the expected repair cost.
Q4: How much can RDM reduce my total cost of ownership?
A robust RDM system typically reduces TCO by 12–20% over 5 years. By cutting service call costs (40–60% reduction) reducing downtime duration (50%+ reduction), and enabling remote content updates that eliminate manual site visits.
Q5: Is it worth paying more for energy-efficient displays?
Almost always yes. Typically, a display that saves 100W costs approximately $100/year less to operate (at $0.15/kWh, 18 hrs/day). Over 5 years, that’s $500 per screen –typically exceeding the price premium for the efficient model. For 50-screen deployments, savings reach $25,000+.
Q6: What is the single biggest hidden cost in display deployments?
Content creation is the most frequently underestimated cost. Most buyers budget only for hardware and installation, ignoring the $500–1,000+/screen/year needed for ongoing content production. In the 50-unit outdoor network example, content creation accounted for 27.5% of 5-year TCO –equal to the hardware cost itself.
Q7: How do I calculate TCO for a mixed-fleet deployment?
Calculate TCO per display model (using the 8-component framework above), then aggregate by the number of units of each model. Be sure to account for increased spare parts complexity and Training costs from multiple models –add 3–5% to maintenance costs for each additional display model in your fleet.
Conclusione
The true cost of a commercial display deployment extends far beyond the purchase order. Over a 5-year lifecycle, hardware represents less than half of total spending, with power consumption, maintenance, software, and content creation comprising the majority. The most expensive display on a unit-price basis is often the. Most economical on a TCO basis –because premium engineering delivers lower power consumption, higher reliability, included RDM software, and longer warranties.
Key takeaways:
Use our window display TCO comparison to benchmark your results against industry benchmarks for single vs double-sided configurations.
- Always calculate 5-year TCO, not just unit price –use the model above as your framework
- Remote device management (RDM) is the single most impactful TCO reducer –it cuts service costs and downtime simultaneously
- Energy efficiency matters: a 100W difference per screen adds $500+ over 5 years per unit
- Cheap displays are a TCO trap –non-standard parts, inflated specs, and lack of remote diagnostics create long-term costs that erase short-term savings
- Quantify all revenue streams when evaluating ROI –advertising alone rarely justifies a display network
Key Takeaways
- Hardware is less than half of 5-year TCO — power, maintenance, software, and content dominate the real cost.
- The cheapest unit-price display is often the most expensive over its lifecycle.
- Build a TCO model (not just PO cost) before comparing supplier quotes (use our RFQ writing guide to standardize what you collect).
- Factor energy use, warranty, spare parts, and CMS fees into every comparison.
- Use a 5-year calculator to make defensible, total-cost procurement decisions.
Esplora tutto Hub della guida all'acquisto di segnaletica digitale per esterni per ulteriori consigli sugli acquisti in materia di approvvigionamento, applicazioni e tendenze di mercato.