FR
 EN
 IT
 ES
 DE

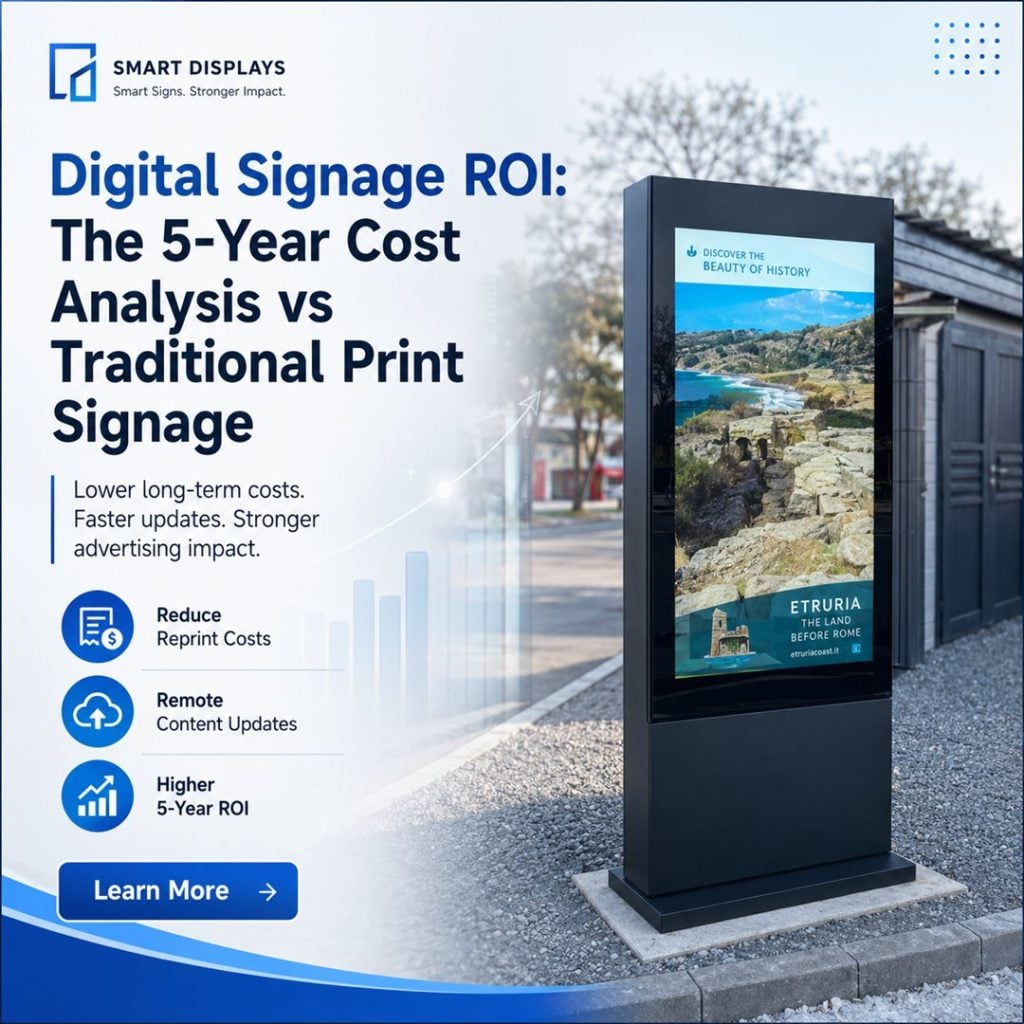
Table des matières

Executive Summary
If you are evaluating whether to replace traditional print signage with signalisation numérique, the bottom line is this: over a five-year period, digital signage delivers a lower total cost of ownership (TCO) and significantly higher return on investment (ROI) than static print — especially for businesses with three or more locations. This article breaks down the hard numbers.
Why TCO Matters in Signage Decisions
Total Cost of Ownership goes beyond the purchase price. It includes installation, content production, ongoing maintenance, energy consumption, and — crucially — the opportunity cost of not being able to update messaging in real time. For multi-location businesses, print signage is a recurring expense that never builds value.
5-Year Cost Comparison: Print vs. Digital Signage
The following comparison assumes a single-location deployment with 3 display points (e.g., one storefront window display, one lobby screen, one menu board). Print costs include professional design, printing, shipping, and installation per change cycle (monthly updates). Digital signage costs are based on MWE outdoor-rated digital signage displays with a 5-year expected lifespan.

Year 1 Investment
- Print signage: Initial fabrication + installation for 3 displays: ~$1,200. Monthly design+print+install at $180/cycle × 12 months: ~$2,160. Year 1 total: ~$3,360
- Digital signage: 3 × MWE outdoor displays (32″–55″): ~$4,500 total. Installation and CMS setup: ~$600. Content design per month: $50 (in-house or template-based). Year 1 total: ~$5,700
Digital signage has a higher upfront cost — but the gap narrows fast.
Years 2–5
- Print: ~$2,160/year × 4 years = $8,640
- Digital: Content updates $600/year + electricity $200/year + negligible maintenance = $800/year × 4 years = $3,200
5-Year Total Comparison
- Print Signage 5-Year TCO: ~$12,000
- Digital Signage 5-Year TCO: ~$8,900
- Net savings with digital: ~$3,100 (26% lower TCO)
For businesses with 10+ locations, the savings compound dramatically. Digital signage at 10 locations saves ~$31,000 over five years compared to print — plus you gain the ability to update all locations instantly. For a deeper look at hardware options, explore MWE indoor digital signage solutions.
Beyond Cost: Revenue Opportunities Digital Signage Unlocks
1. Dynamic Pricing and Promotions
Digital signage lets you run time-sensitive offers, happy-hour pricing, and flash sales that print cannot match. Restaurants using digital menu boards report an average 8–15% increase in check size from suggestive selling and dynamic upselling.
2. Advertising Revenue
Outdoor digital signage in high-foot-traffic locations can generate third-party advertising revenue. A single storefront display running partner ads during idle time can earn $200–$800/month, turning a cost center into a profit center. MWE’s OMC remote management system makes it easy to schedule ad slots across a network.
3. Reduced Content Waste
Print signage waste is real: every campaign change means discarded materials. Digital signage eliminates this entirely. With MWE’s IP65-rated outdoor displays built for 24/7 operation, your investment keeps working without material waste or recurring production costs.
Hidden Costs That Favor Digital Signage
- Labor: Print changes require staff time for installation and removal. Digital updates take minutes from any device through cloud-based CMS.
- Errors: A print error (wrong price, typo) means reprinting the entire batch — costly and slow. Digital errors are fixed in seconds.
- Compliance: Regulatory changes (menu labeling laws, pricing rules) can force print rewrites overnight. Digital signage adapts instantly.
ROI Scenarios by Business Type
| Type d'entreprise | Print 5-Year Cost | Digital 5-Year Cost | Additional Revenue | Net ROI Advantage |
|---|---|---|---|---|
| Single retail store | $12,000 | $8,900 | ~$2,000 | +$5,100 |
| 5-location QSR chain | $60,000 | $44,500 | ~$15,000 | +$30,500 |
| 10-location retail chain | $120,000 | $89,000 | ~$40,000 | +$71,000 |
Questions fréquemment posées
How long do digital signage displays typically last?
Commercial-grade displays like MWE’s outdoor kiosks are designed for 50,000–100,000 hours of continuous use — roughly 5–7 years of 24/7 operation. Consumer-grade displays typically fail within 1–2 years in commercial environments.
Can digital signage work without an internet connection?
Yes. MWE (Marvel Technology) support USB plug-and-play playback and local media storage. The cloud-based CMS is optional for content management, not mandatory for daily operation.
What is the break-even point for switching from print to digital?
For most single-location businesses, break-even occurs between month 18 and month 24. For multi-location businesses, it can be as early as month 12 due to compounding print costs.
Can I use my existing print content on digital signage?
Many print designs can be adapted for digital displays. MWE’s team assists with content migration to ensure brand consistency across formats.
How much electricity does a digital signage display use?
A typical 43-inch commercial display consumes 150–250W, costing roughly $15–$25 per month in electricity depending on local rates. MWE (Marvel Technology) are engineered for energy efficiency with auto-brightness adjustment based on ambient light.
Conclusion
The numbers are clear: digital signage offers a 26% lower 5-year TCO compared to print, plus revenue-generating capabilities that print cannot match. For businesses with multiple locations or high-frequency content changes, the decision is not whether to switch — it is how fast. Contact MWE Display to calculate your specific ROI and find the right digital signage solution for your business.
Ready to calculate your digital signage ROI? Contacter MWE for a personalized cost comparison across display types, quantities, and deployment locations.
For a detailed component-level cost comparison over 5 years — including the single-sided vs double-sided window display trade-off — refer to our 5-Year TCO Comparison Guide.
Explore the full Guide d'achat de solutions d'affichage numérique extérieur for more buying guidance across procurement, applications, and market trends.