ما الذي يبحث عنه المتسوقون لديك؟ إطلاق العنان لقوة تحليلات الأكشاك
SEO Meta Description: Door counters tell you “who” visited, but they can’t tell you “why.” Discover how Interactive Wayfinding Kiosks use search logs, heatmaps, and behavior data to optimize tenant mix and boost mall ROI.
الكلمات المفتاحية: Retail Analytics, Smart Mall Data, Wayfinding Kiosk Analytics, Shopper Intent, Tenant Mix Strategy, Digital Signage ROI
Stop Guessing: Why Your Wayfinding Kiosk is an Underrated Data Goldmine

In the operations center of a modern shopping mall, management teams are often glued to screens showing data from people counters: “We had 50,000 visitors today, up 10% from yesterday.”
But this data is incomplete. It tells you volume, not intent. Of those 50,000 people, how many came specifically to eat? How many left frustrated because they couldn’t find a nursing room? And how many were looking for a brand that isn’t even in your mall?
Traditional passive sensors cannot answer these questions. Interactive Touch Kiosks can. Every touch, every search query, and every page dwell time is a customer actively telling you exactly what they want.
The Compass for Leasing: Fixing the Tenant Mix
For a Leasing Director, the biggest nightmare is “blind recruitment.” The backend search logs of your digital kiosks serve as the most direct market research report available.
- The Value of “Zero Results”: If your data shows that last month, there were 500 searches for “Lululemon” or “Steakhouse,” but you don’t currently have these tenants, you have a problem—and an opportunity. Actionable Insight: This is hard evidence of unmet demand. Take this data to your next meeting with potential tenants. Showing a brand that “500 people are already looking for you in our mall” is a far more powerful negotiation tool than empty promises.
- Associative Behavior: What do customers search for after they search for “Cinema”? Do they look for “Bubble Tea” or “Fine Dining”? Actionable Insight: This behavior reveals the perfect “tenant neighbors.” You can optimize your floor plan to cluster complementary businesses together, thereby increasing cross-selling opportunities.
Screen Heatmaps: visualizing Real Interest
Click volume doesn’t lie. Through visual heatmaps, you can see exactly which parts of the screen are getting the most attention.
- Category Preferences: Is the “Dining” button getting 80% of the taps, while “Fashion” only gets 10%? If so, your mall may have evolved into a “dining destination” for the local community, and your retail strategy needs to adjust accordingly.
- Promotion Effectiveness: You placed a “Summer Sale” banner on the kiosk’s home screen. But is the heatmap area over that banner glowing red (hot/high clicks) or blue (cold/ignored)? This gives you instant A/B testing feedback on your marketing creatives.

Demographics & Inclusivity: The Invisible ID
While wayfinding kiosks respect privacy and don’t record personal identities, they do capture valuable group characteristics.
- Language Toggle Rates: If analytics show that 20% of users are switching the interface to Spanish or Chinese, it indicates a significant demographic shift in your visitor base. Actionable Insight: Do you need to hire multilingual concierge staff? Should your audio announcements be bilingual?
- Accessibility Mode Usage: High frequency of the “Accessibility/Wheelchair Mode” button indicates a strong presence of elderly or disabled visitors. This alerts facility management to double-check the functionality of elevators and ramps to ensure a barrier-free environment.
Monetizing Data for Ad Sales
When selling DOOH (Digital Out-of-Home) advertising slots to tenants, data is your strongest ally. Instead of a vague claim like “We have high foot traffic,” you can confidently state:
“According to our kiosk analytics, between 5:00 PM and 7:00 PM, there are over 3,000 searches for ‘Sports Gear’ in this specific zone. Placing your sneaker ad here, at this time, guarantees the highest conversion rate.”
Conclusion: From Passive Service to Active Intelligence
If you view your digital kiosk merely as an electronic replacement for a printed map, you are leaving 90% of its value on the table.
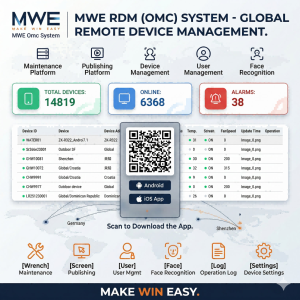
في Marvel Technology, our Smart Wayfinding Solutions provide more than just industrial-grade hardware; they come equipped with a powerful CMS Analytics Dashboard. We transform every fingertip interaction into quantifiable business insights, helping mall managers move from “gut feeling” decisions to data-driven strategies.